Products

QA Advisor
Scouting, imagery, recommendations and records for agronomists and ag retailers.

QA Farmer
Your advisor's recommendations and field records, on your phone.

Pricing
Straightforward plans built to scale with you.
QA Advisor
Start your 14-day free trial. No credit card required.
Start Free Trial →
Who We Serve

Agronomists
Turn field expertise into action without turning your evenings into paperwork.
Farmers
Stay connected to the information and expertise behind your operation.

Retailers & Co-ops
A consistent way to work and visibility across every acre.

Processors
Visibility into decisions and practices across acres you do not operate.
Customer stories
How advisors and growers use FarmQA in season.
Read the stories →
Collect & Analyze

Crop Scouting & Issue Detection
Capture what you see in the row, where you see it.

Soil Sampling & Nutrient Analysis
Sampling plans, lab results and nutrient maps by field.

Field Mapping & Satellite Imagery
Field boundaries, layers and imagery in one map.

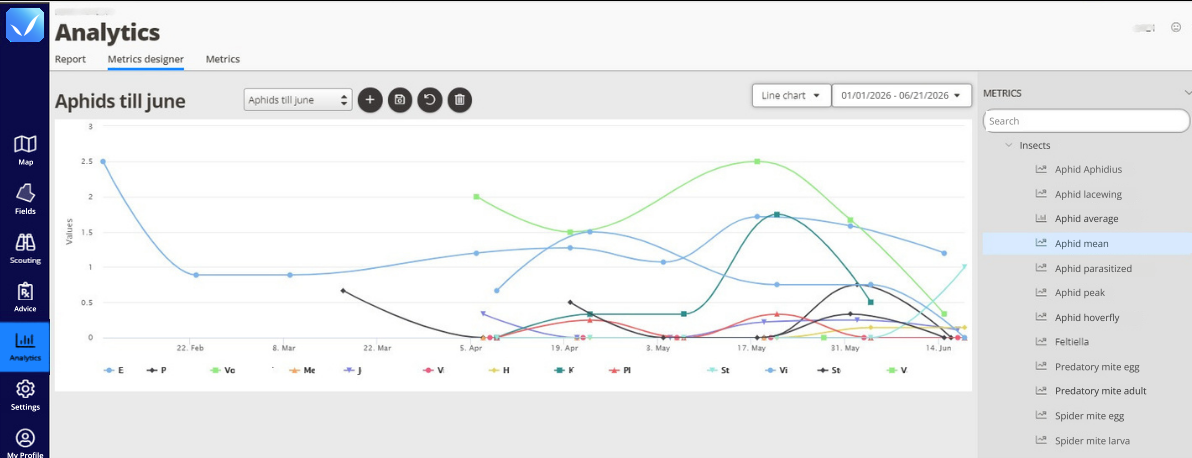
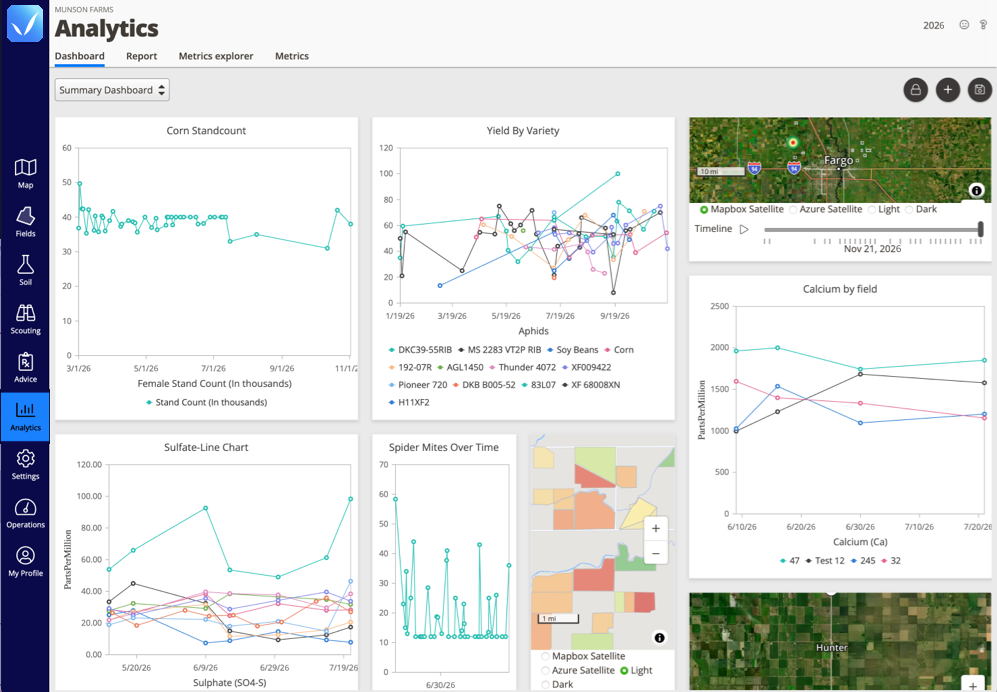
Yield Analysis & Analytics
Turn a season of records into the next decision.
Advise & Deliver

Advice & Recommendation Delivery
Branded reports to the grower from the field.

Crop & Field Planning
Plan the season by field, crop and input.
Zones & Variable Rate Prescriptions
Write prescriptions from your own field data.

Application Tracking & Compliance
Know what was applied, where and when.
Connect & Engage

Grower Engagement
Keep growers in the loop without extra calls.

White-Label Branding
Your services, your brand, powered by QA Advisor.
All solutions
See how every part of the season connects.
Explore solutions →
Learn

Blog
Agronomy, software and season notes.

Webinars
Live and on-demand product walkthroughs.

Customer Stories
What advisors and growers say.
Get help

Support
Guides, FAQs and help from a real person.

Partners
Integrations and partner programs.

Stay Connected
Product updates, webinars and news by email.
Webinars
Explore FarmQA On Demand
Watch product demos, how-tos, and agronomy workflows whenever it works for you.
Watch now →