FarmQA 2021 Spring Feature Updates
We have been hard at work since our last update! Below are a few of the new features you will now see in FarmQA.
Field journals
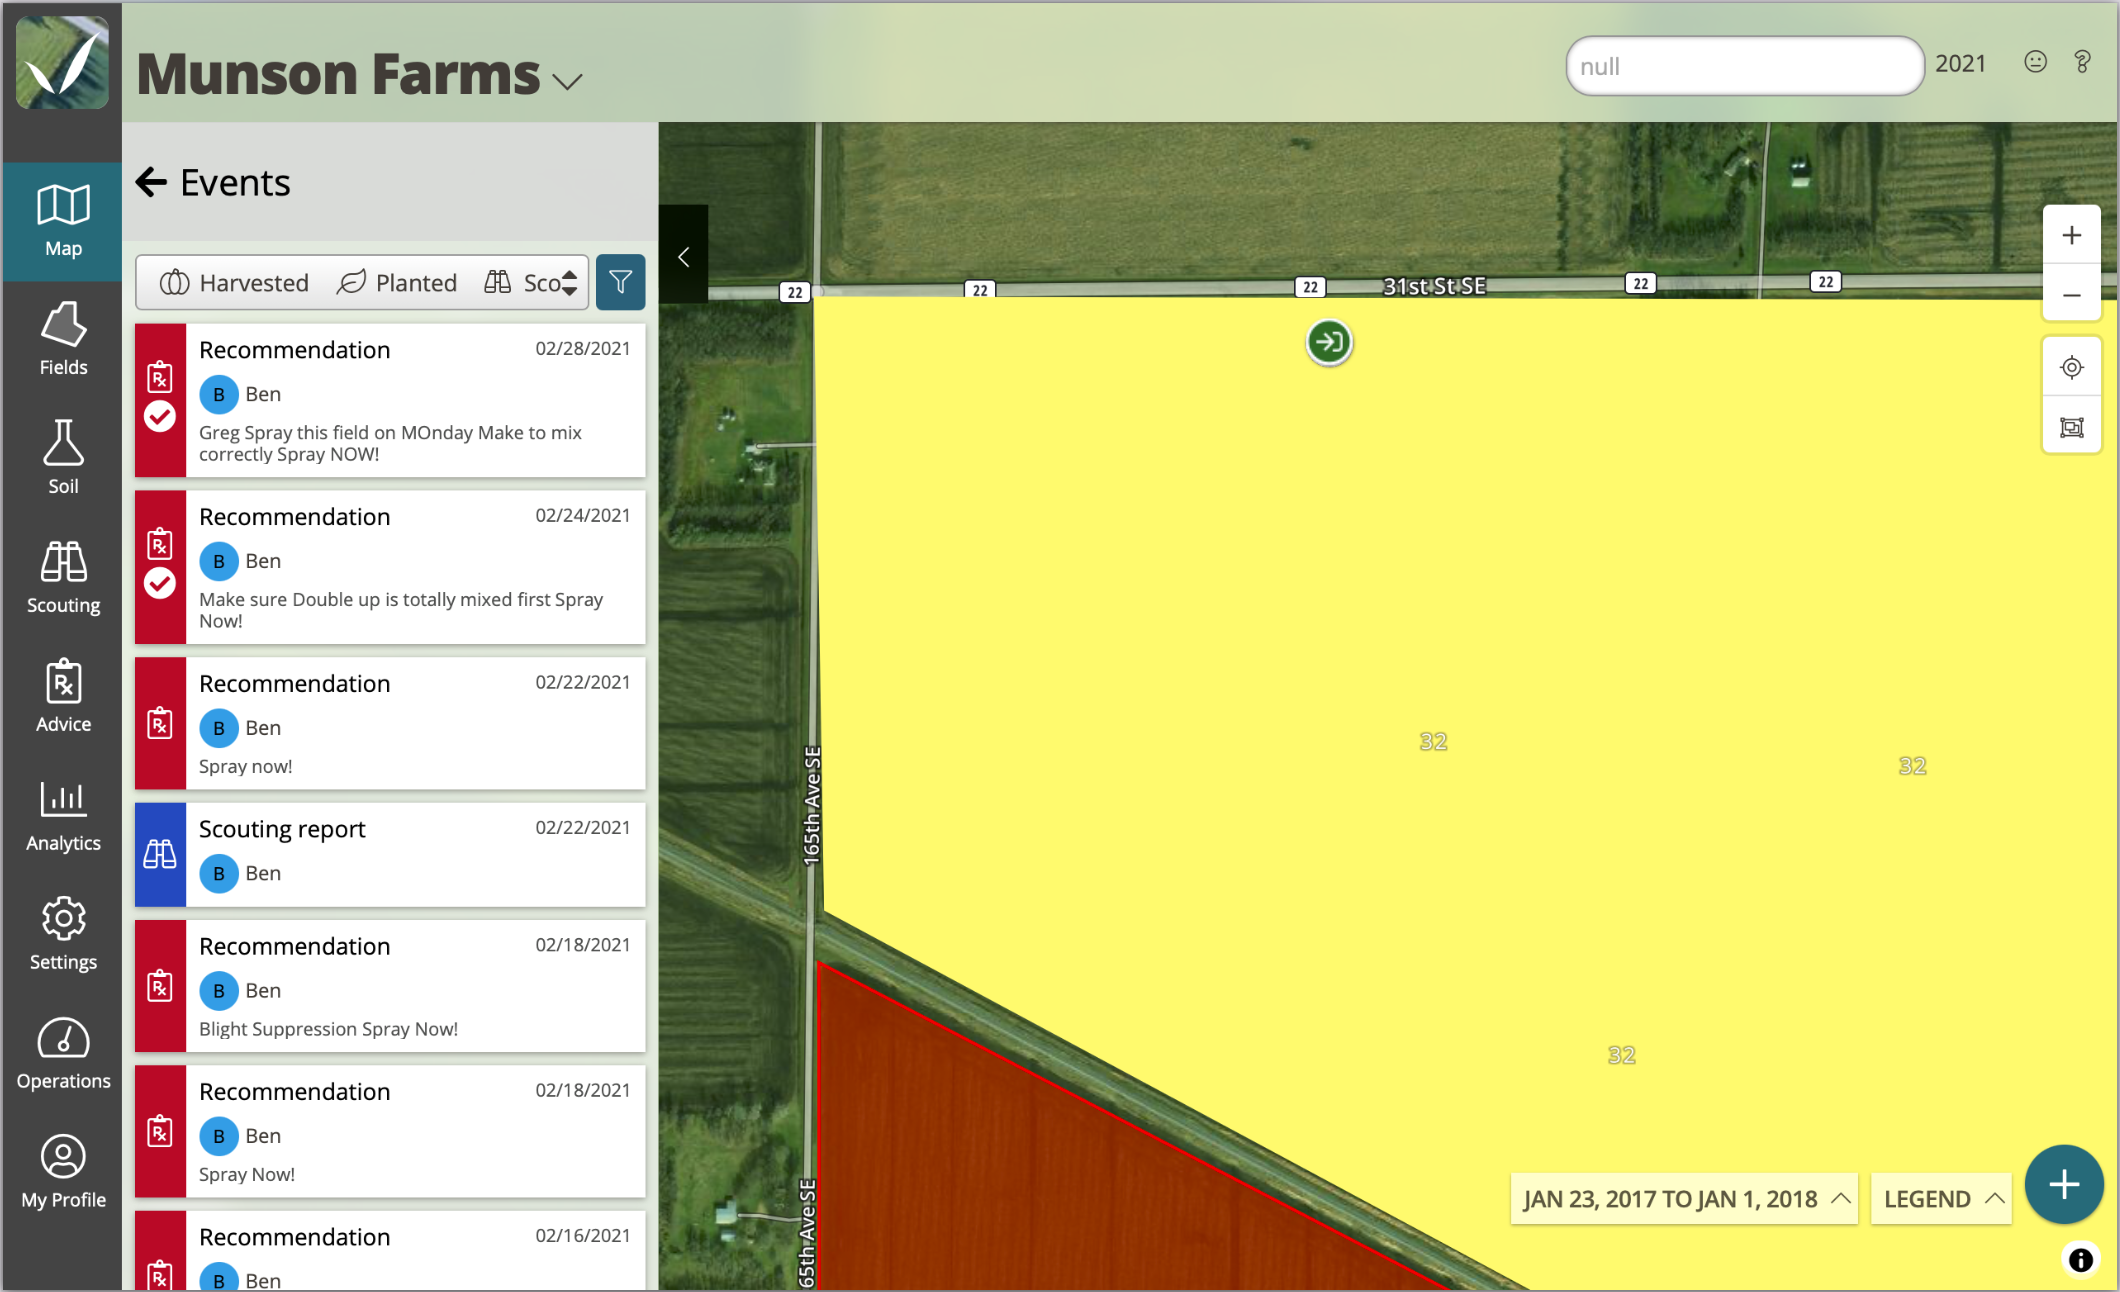
Field journals are a new way of viewing the events related to a field throughout a season. You'll see all scouting reports, chemical recommendations, plant, and harvest events in a list format.
You can filter by event type to see the recommendations on a field. Clicking the event presents a full-page view of the details for each item line.
We plan on much more additions to our Journal capabilities. In future releases, we will add additional event types such as tillage records or fertility applications. Journals will also be a placeholder for automated event capture through integrations with MyJohn Deere and more.
Learn more about field journals
Multi-select reports on mobile
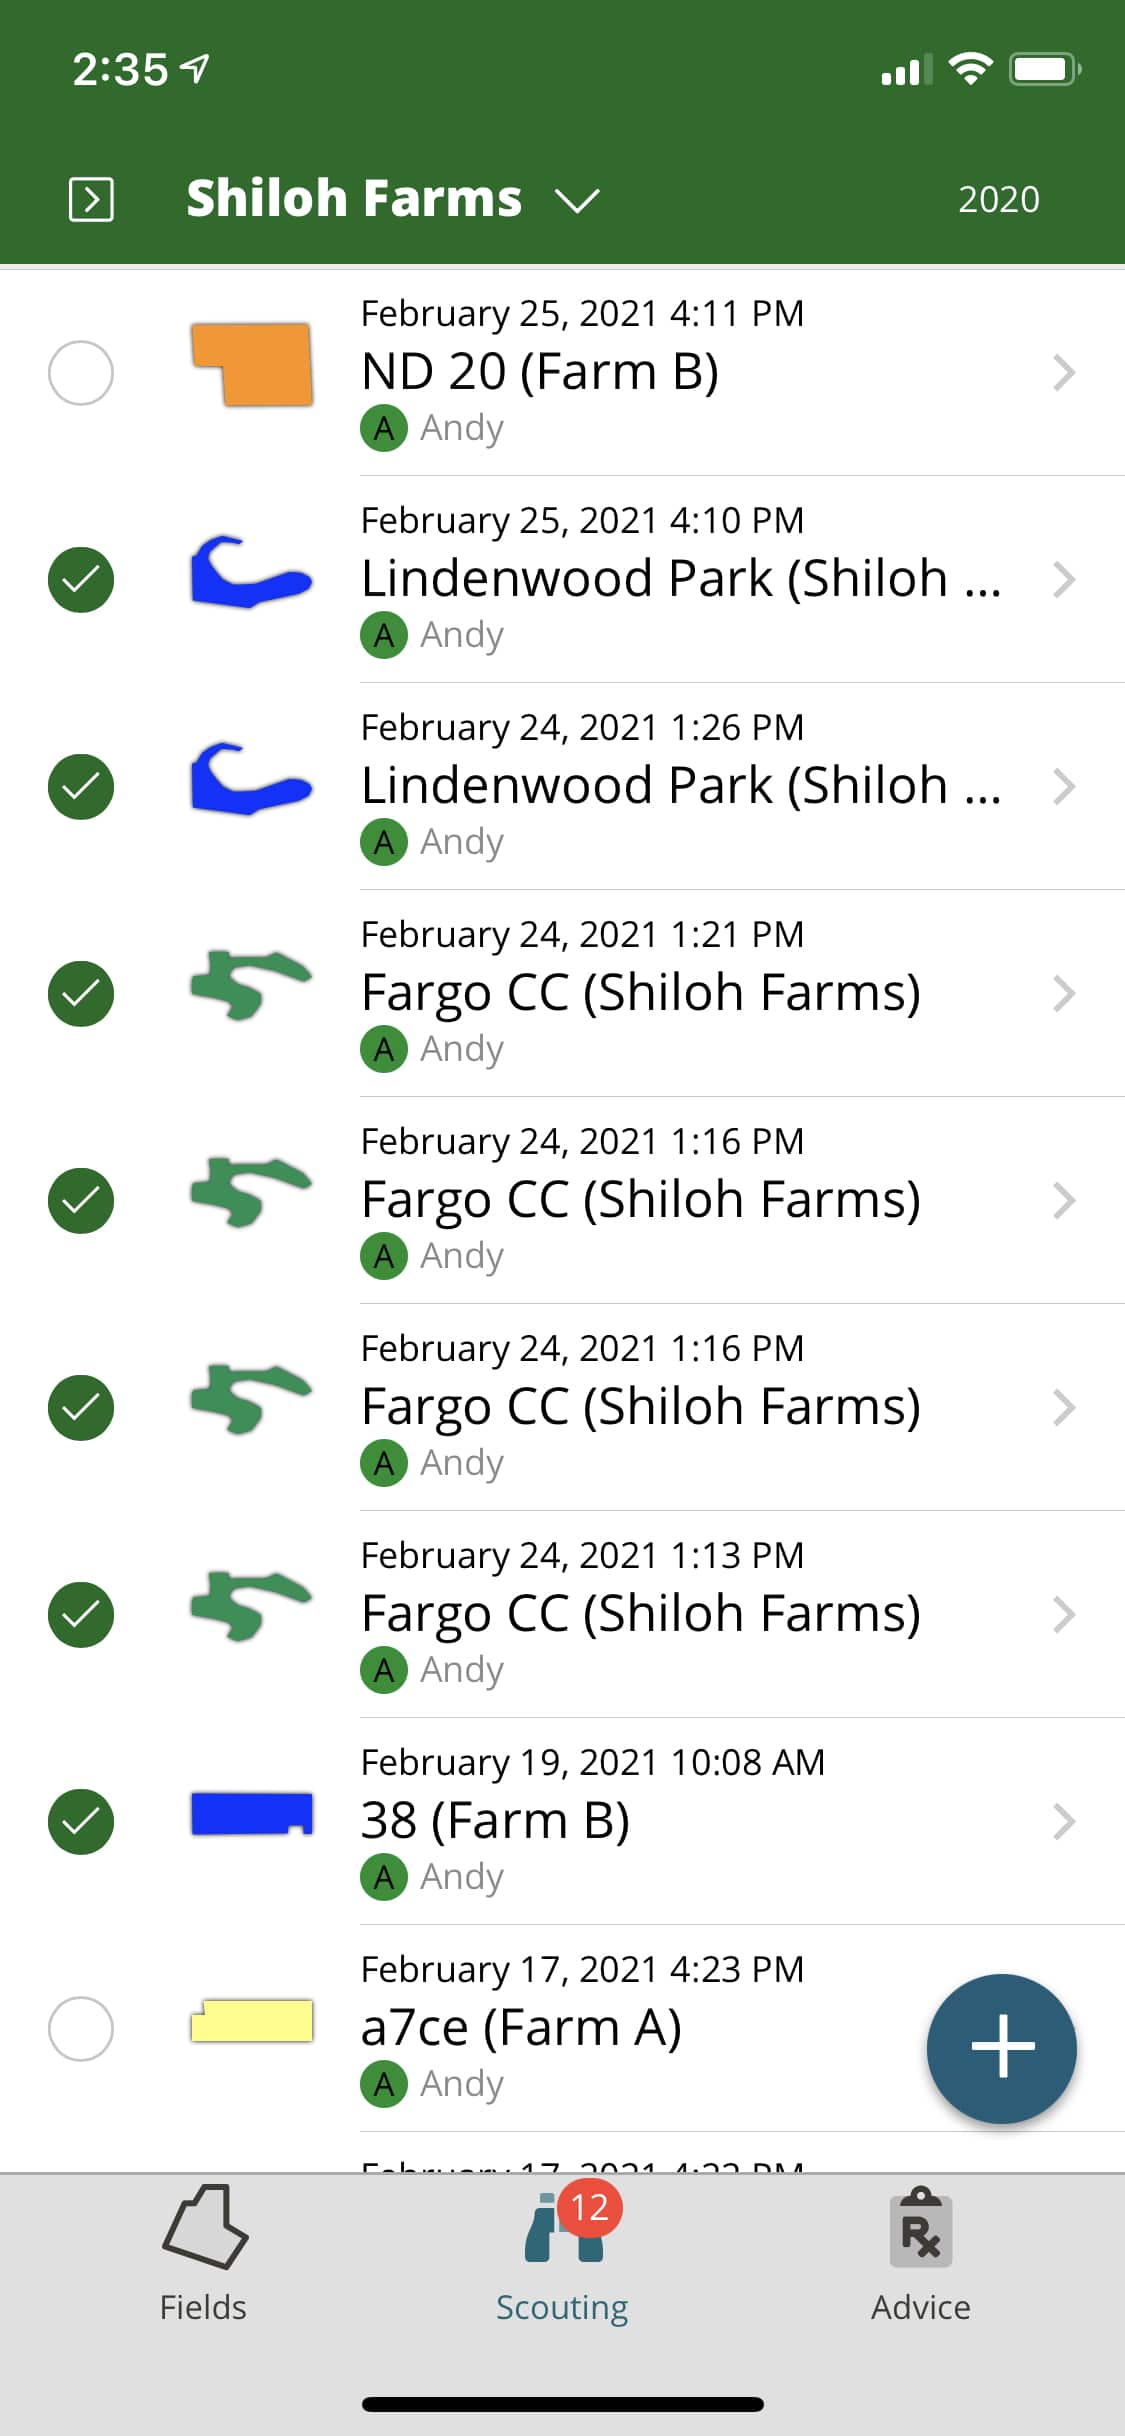
Users can now combine multiple scouting reports into a single PDF from the mobile application allowing you to send a single report containing up to 25 scouting reports to your growers. Report generation is accomplished with the PDF output or using the share button, with options to send via group text, WhatsApp, or email.
Learn more about bulk export of scouting reports
Advice improvement
We've made quite a few improvements to our advice and recommendation capabilities.
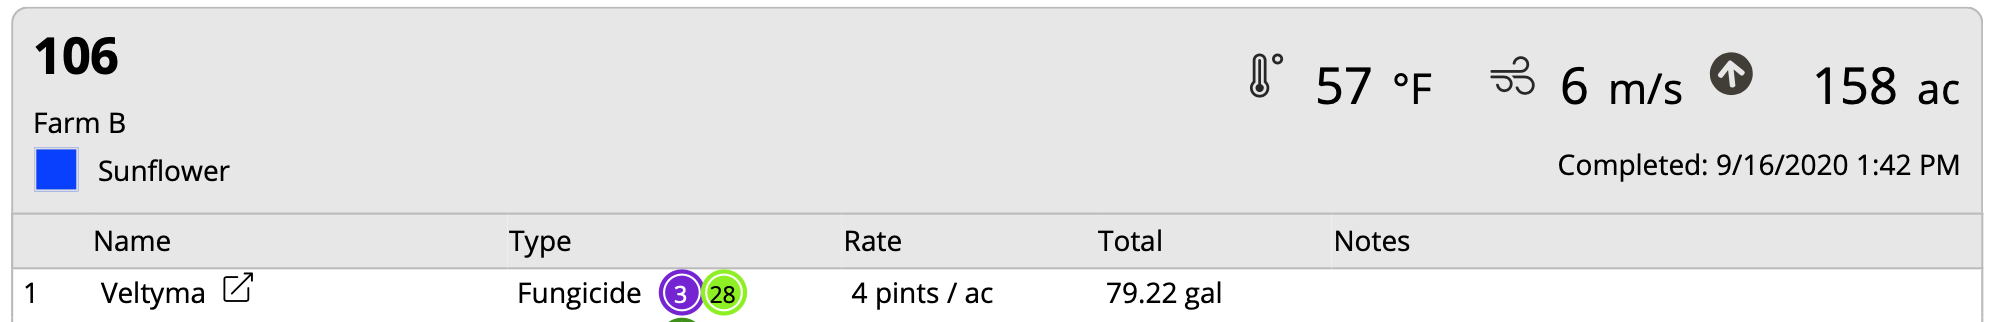
- Mark recommendations as complete. As an agronomist, you can now write recommendations in FarmQA, and your growers can mark the recommendation as complete when they spray the field. This functionality is available in both our mobile app and web application.
- Weather data associated. Completed recommendations will automatically save weather information — temperature, wind speed, and wind direction — down to the hour the spray event occurred, in the final report.
- Labels available on mobile. Chemical labels are now available on the FarmQA mobile application for easy access by anyone. Access labels by viewing the product details of an individual chemical while writing a recommendation.
- Product totals in PDF report. A shopping list is now automatically included when generating a recommendation-only report. The product of multiplying rates by field size of every chemical indicates the total quantity needed to complete the spray job.
- Auto-sync EPA labels. A new preference has been added that will automatically pull in new chemical labels when they are released to the EPA. A user can opt-in or out of the auto-sync feature at any time.
- Write recommendations from our web app. Now write crop treatment recommendations using FarmQA on the web. Scouts collect in-field data, agronomists review those reports, and then write up the treatment advice after the field check.
Coming Soon!
We're excited to introduce several significant additions to the FarmQA product lineup. These features will enhance the experience of the agronomist, scout, and grower.
For this season, these new features will be released as beta. Feedback is highly requested!
Spatial layers
We are building a spatial layer portal that allows users to import spatial data into FarmQA. View the spatial layers on the mobile app -- connected or disconnected -- to assist in the field checking process or soil sampling.
Examples include yield data, zone maps, NDVI imagery, or soil sampling points. All of which can be stored per field and set as either a permanent or growing season-specific layer. This data will be visible to all roles making it a great data repository and a diagnostic tool for everyone.
We also see this as a stepping stone for future integrations to make the importing of data seamless for you. We would love to hear from you on what sources of information you believe we should integrate with to enhance your digital agronomy tool belt.
Metrics
It can be hard to derive meaningful insights and action from individual scouting reports. Metrics is our answer to change that for both the agronomist and grower.
Simply mark a question on a scouting template as a metric. All answers to that question will aggregate into a dashboard view alongside other metrics. For example, you could see growth stage, aphid pressure, and disease damage all as columns in the dashboard for all fields in your account. Manipulate the data to show the highest or lowest pressure levels per column for a specific crop or variety.
Additionally, things like fertility data and real-time weather readings can contribute to the dashboard allowing for further analysis of scouting data against other data sets.
Geo markers
We have heard different use cases to mark permanent GPS locations in FarmQA and contribute data to those points during future field checks. We are building this function and calling it Geo-markers as it applies to several different applications.
Soil sampling. Drop markers where soil or tissue samples are to be collected, using the phone's GPS while in the field for location accuracy, or from a Shapefile or KML file.
Insect traps. Insect trap locations can easily be set and located for future visits. Click on the trap location each week to enter counts. View the counts as a metric to see trends over time or compared to other traps.
Consistent scouting. Locations can be marked during the spring, then displayed to a scout or agronomist upon returning to the field for consistency throughout the season.
We're excited about these new features and think that you'll find them to be a useful part of your digital agronomy toolset as well.