FarmQA arms Berry Konsult with tools to help strawberry growers manage soil health, minimize pests, and produce healthy crops.

Have you ever looked closely at the delicate flower of a strawberry plant? The intricate white petals form a protective circle around the yellow center, bearing a striking resemblance to a wild rose. The likeness should come as no surprise as roses and strawberries are first cousins, both members of the genus Fragaria. Mmmm! That’s one family reunion for the senses!
Klaas Plas, an agriculture consultant and strawberry specialist, has been serving berry growers for more than 30 years, bringing to this vocation an expertise in agriculture and horticulture that spans several decades.
Since starting Berry Konsult in 2010, Plas has served growers in several countries and continents from the Netherlands (where he and his family reside) to Germany, Hungary, Australia, Canada, and the United States, to name a few. With such a broad customer base, for Plas, teleconsulting was a necessity long before a pandemic made it commonplace.
Managing Grower Differences
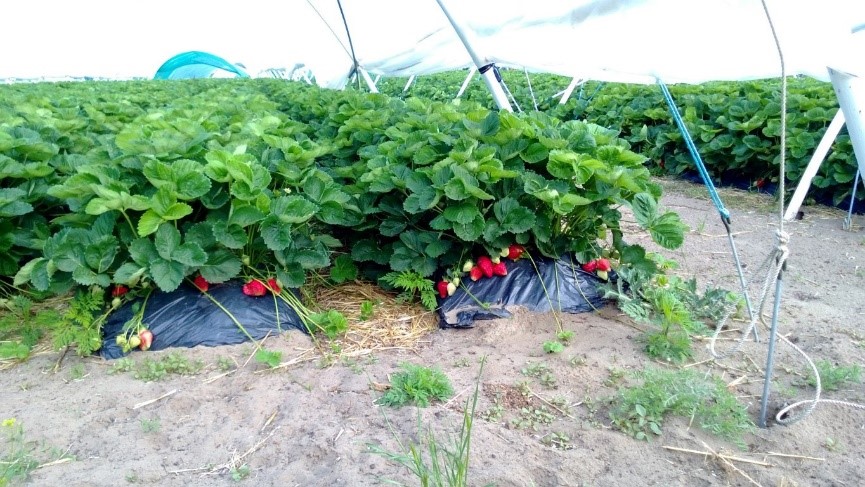
Plas helps his growers by consulting on everything needed to produce a bumper crop, including selecting and monitoring varieties, measuring growth and fertilizer inputs, irrigation, plant protection, climate control, and everything in between. His growers span from the largest at 250 external acres (100 hectares) to internal production sites (polytunnels or greenhouses) between 37 acres (or 15 hectares) to smaller production plots of fewer than 400 square meters. It’s safe to say there’s a lot of variety in growing these berry varietals. His clientele also includes strawberry propagators or breeders. And Plas loves the differences he experiences with the assorted grower types and the materials in which berries are grown - whether soil or substrate.
Saving Time on Grower Reports
Plas used Microsoft OneNote for his records in the early days of his consultancy. He'd make his notes on site, and then after visiting several growers in one day, he'd spend between 30-45 minutes on each grower report. With FarmQA, the time he saves is significant. “I estimate I save up to 10 minutes per scouting location, and my reporting time has been reduced by at least half,” Plas projects. “I evaluated about five scouting apps, and FarmQA was the right one for me.”
Getting a prompt response is critical for someone in a time-sensitive role like Plas. “One of the things I like about FarmQA is that they really listen to what’s going on,” Plas said. “With the other scouting app I tried, for example, if I had some questions or notes, I never got a reaction. That doesn't work for me.”
Tracking (and Scouting) What’s Important
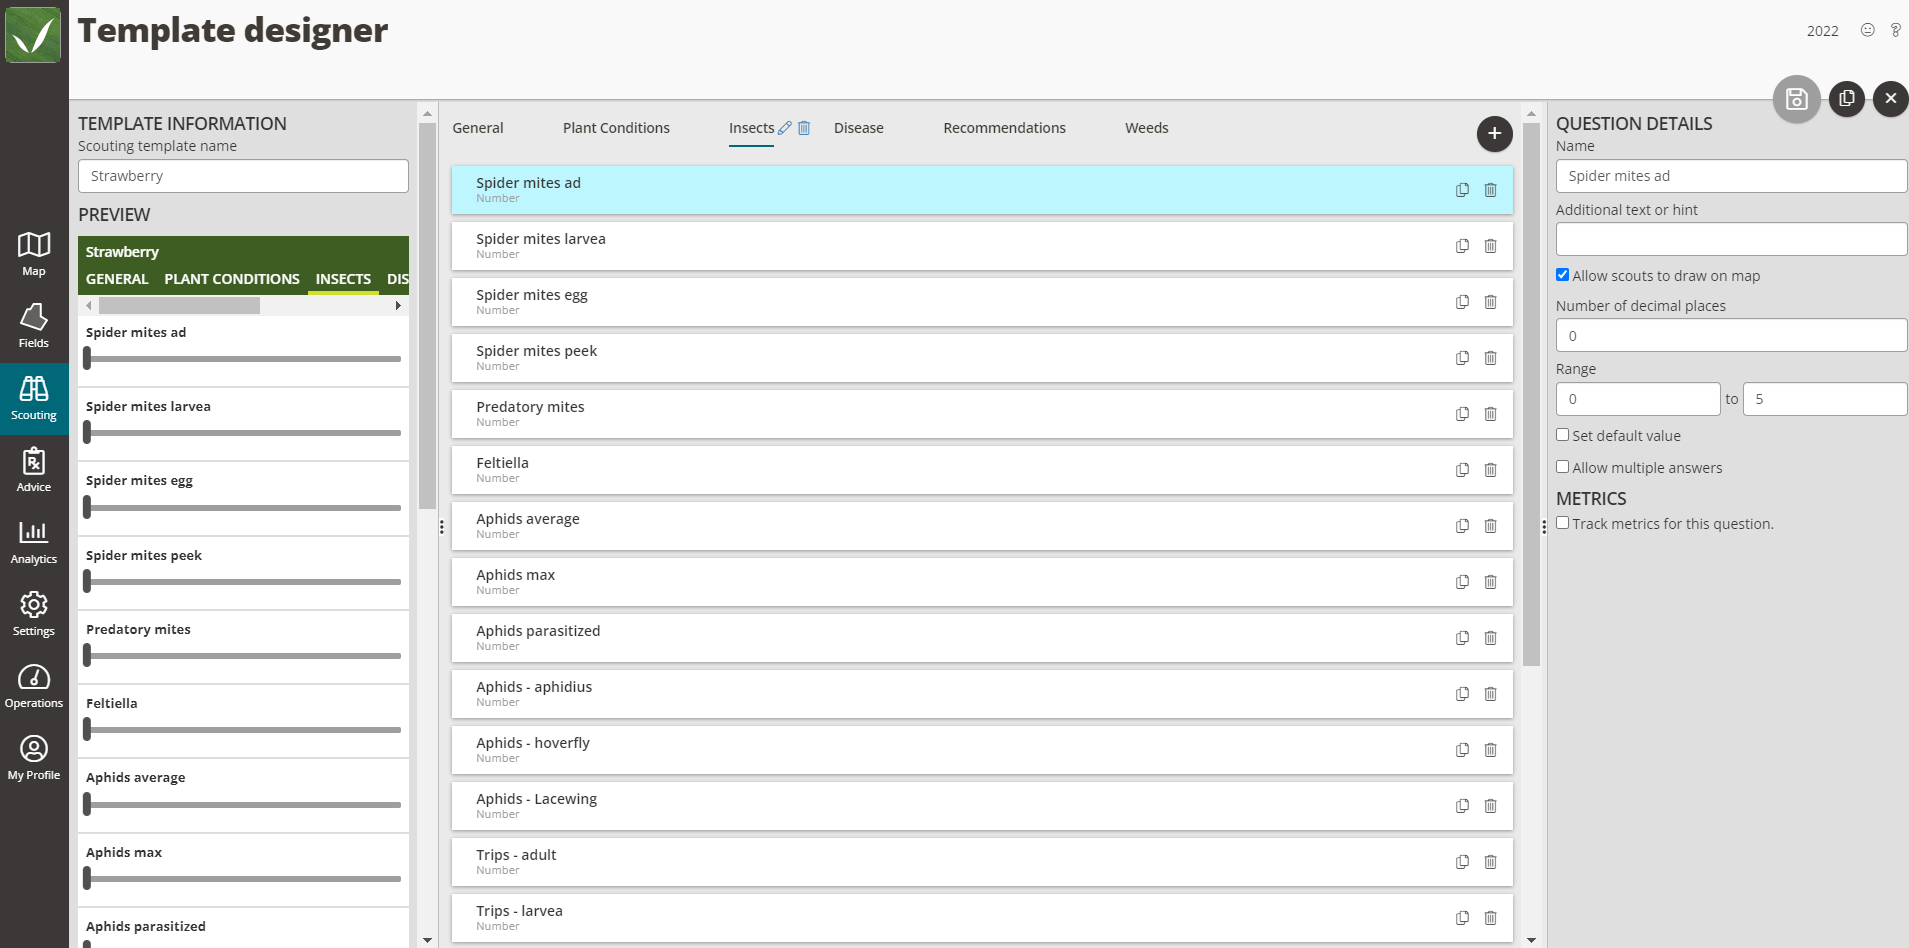
In addition to prompt service, one of the reasons FarmQA edged out the competition was the flexibility of the scouting templates. Given Plas’s clientele, the disease and pest challenges can differ quite a bit from those grown in the elements to those in an internal, protected environment; and even those production methods vary. For example, some might use direct systems where the substrate is spread directly over gutters, and the plants grow directly without containers, while others use containers. Some use grow bags placed on long, waste-high trestle tables and still others in hanging trays. Some plant undergrowth, and others use root covers.
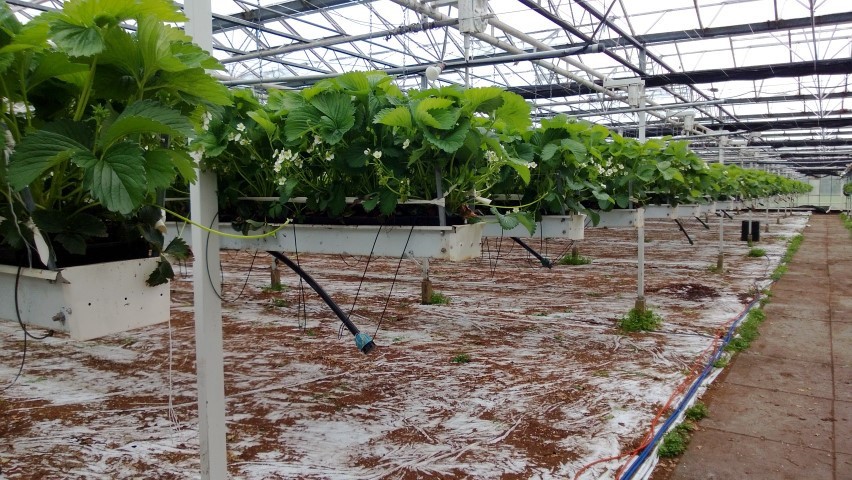
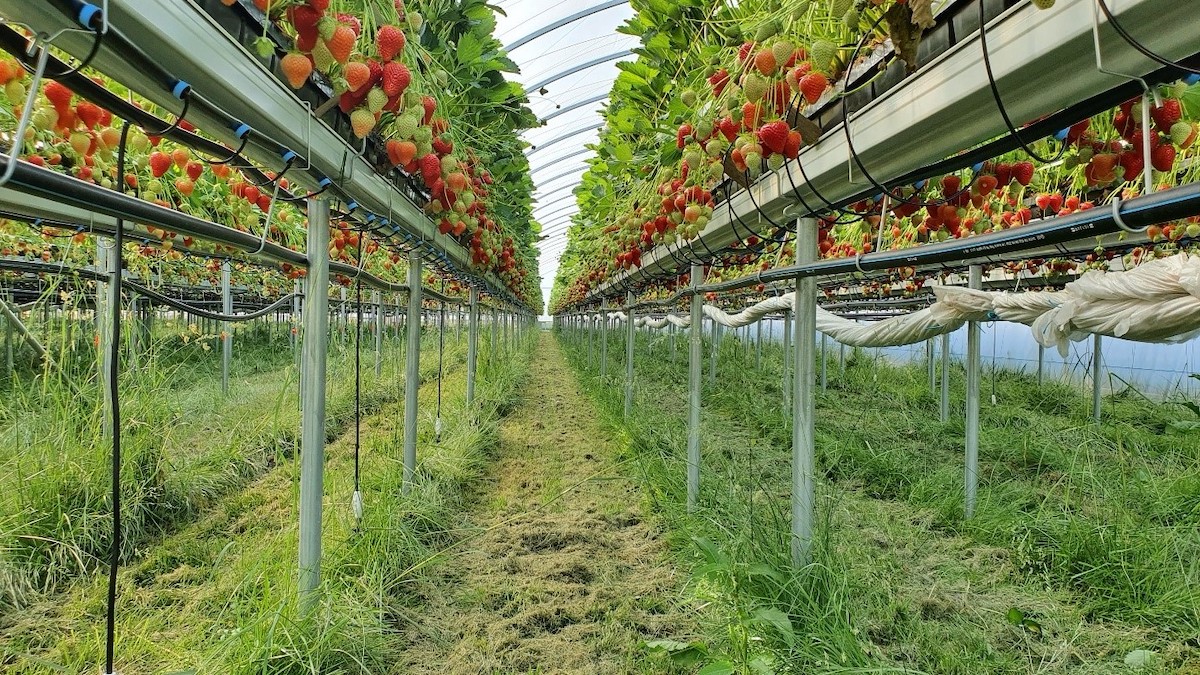
FarmQA’s flexible templates allow Plas to create grower- and environment-specific scouting templates that include the disease and pests typical for a specific grower or environment. For example, one of Plas's growers has a greenhouse with grass between the rows of berries (see Image 3), while another house has an anti-rooting cover between the rows. In this case, the strawberry plants developed differently, and predator development was significantly different too. (There were more natural predators in the house with grass.) Those two different growing environments likely will result in different berry development and disease and pest incidence that Plas will monitor throughout the growing season and year-to-year.
Replacing Spreadsheets with Analytics’ Actionable Views
Analyzing those differences is now much easier since FarmQA introduced Analytics. With the Analytics feature, Plas can compare what’s going on in each field – looking at the level of EC over time (soil electrical conductivity), to monitor nitrogen availability, or to spot the conditions conducive to Botrytis fruit rot (a.k.a. gray mold) or whatever the data shows him. In the past, Plas could keep track of all sorts of research and data in spreadsheets, but doing something timely with that data was basically impossible.
With Analytics, he can compare fields for a single grower and compare grower data to other grower data and spot trends in plant development, soil health, pest incidents, and much more. Often, consultants track data like this in a spreadsheet, but FarmQA Analytics makes it actionable.
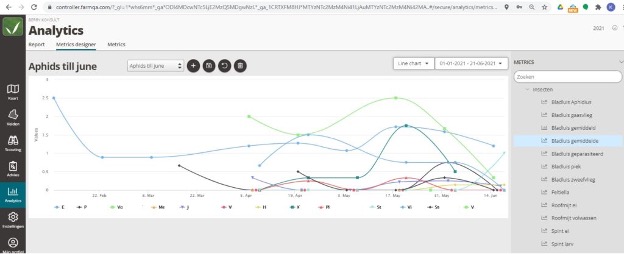
Klaas uses a 0-5 scale to track different pests and diseases issues. 0 tracks no pests and diseases,” 5 indicates “full of pests/diseases” and 3 indicates extra action should be taken. Combining his scale with Analytics makes it easier to determine whether additional action is needed.
“With Analytics, I get a good picture of the number of aphids, for example, and whether they’re going up or down. And how that compares between growers,” says Plas. “By looking at the trends, I have a good idea of whether I need to intervene or whether the problem will likely resolve itself.”
Read more about how Plas uses FarmQA Analytics in his blog “Analytics – a game-changer.” We couldn’t have asked for a better endorsement.
When asked what he would tell other consultants looking for a solution to help their business, Plas had this to say: “I would especially focus on the templates and the reports that can be created, and afterward, the statistics. It’s [Analytics] only at the beginning, but it's a huge option for improving your knowledge about all the things you are seeing.”